B.Draw and label a graph showing global temperature changes over the last 100 years. -Be able to interpret graphs related to global warming and construct conclusions. -Be able to interpret graphs associated with climate changes and construct conclusions.
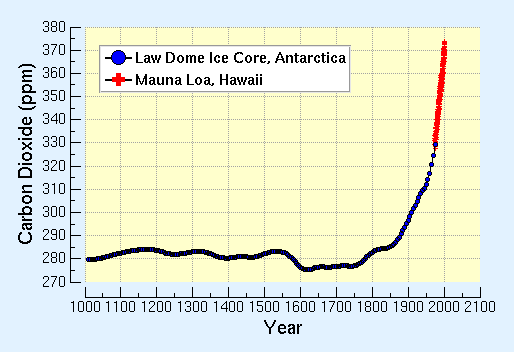
C.Draw and label a graph showing changes in atmospheric carbon dioxide (CO2) levels over the last 100 years. -Be able to interpret a CO2 graph and how it relates to global warming. What can you infer about CO2 and temperature? Link 1, Link 2, Link 3, Link 4, Link 5
D. Explain how the factors that are causing global warming are distinctly different from the factors that caused ozone depletion (ozone layer hole). -What are the factors that are causing global warming? Need more information on global warming? -What are the factors that are causing the ozone depletion (ozone hole)?
E. The oceans are a major CO2 sink, explain what would happen to the oceans if CO2 was to continue to increase at an abnormal rate. –Use “ocean acidification” to explain your answer and discus the environmental effect of ocean acidification.
F. Using the Albedo Effect, explain how glaciers and clouds have impacts on the climates of the Earth.
G. Why does land ice (glaciers) melting change the level of the oceans but sea ice does not?
J. How do climatologists determine past climates and temperatures (proxy data)? Need more information on proxy data?
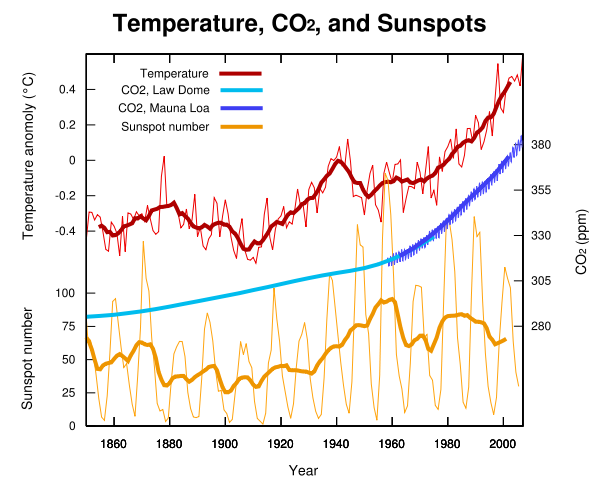
K. What impacts do sunspots have on Earth’s climate? First, watch the video. Second, read about sunspots. Third, study the temperature, CO2, and sunspot graph. -Need more information on sunspots?
